Complete Market Structure Mapping: A Comprehensive Guide
Understanding the Market Structure
A deep understanding of market structure is paramount for successful trading. Market structure refers to the underlying order of the market, including trends, support and resistance levels, and patterns. By mapping out the market structure, traders can identify potential entry and exit points, manage risk effectively, and increase their chances of profitable trades.
Key Components of Market Structure
-
Trend:
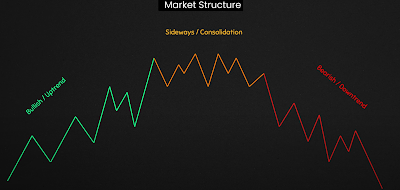
- Uptrend: A series of higher highs and higher lows.
- Downtrend: A series of lower highs and lower lows.
- Sideways Trend: A market that oscillates between a defined range.
-
Support and Resistance:
- Support: A price level where buying pressure exceeds selling pressure, preventing the price from falling further.
- Resistance: A price level where selling pressure exceeds buying pressure, preventing the price from rising further.
-
Patterns:
- Chart Patterns: Recognizable formations on a price chart that can indicate potential future price movements.
- Examples: Head and Shoulders, Double Top/Bottom, Triangles, Flags, and Pennants.
- Chart Patterns: Recognizable formations on a price chart that can indicate potential future price movements.
Mapping the Market Structure
To effectively map the market structure, traders can use various tools and techniques:
-
Chart Analysis:
- Candlestick Charts: These charts provide detailed information about price movement, including open, high, low, and close prices.
- Line Charts: These charts connect the closing prices of each period, providing a simple visual representation of price trends.
- Bar Charts: These charts show the high, low, and closing prices for each period.
-
Technical Indicators:
- Moving Averages: These indicators smooth out price data to identify trends and potential reversals.
- Relative Strength Index (RSI): This oscillator measures the speed and change of price movements to identify overbought and oversold conditions.
- Moving Average Convergence Divergence (MACD): This indicator compares two moving averages to identify trend changes and potential reversals.
-
Fibonacci Retracement and Extension:
- These tools are used to identify potential support and resistance levels based on key Fibonacci ratios.
Practical Tips for Mapping Market Structure
- Start with a Clear Chart: Use a clean chart with minimal clutter.
- Identify the Trend: Determine the primary trend direction.
- Locate Support and Resistance Levels: Identify key levels where price tends to bounce or stall.
- Recognize Chart Patterns: Look for recognizable patterns that can signal potential price movements.
- Use Technical Indicators Judiciously: Combine technical indicators with price action to confirm signals.
- Practice Regularly: Consistent practice is key to developing your skills in market structure analysis.
Conclusion
By mastering the art of market structure mapping, traders can gain a significant edge in the financial markets. By understanding the underlying order of the market, traders can make more informed decisions, manage risk effectively, and increase their chances of long-term success.
Remember: Market structure is dynamic and can change rapidly. It's essential to stay updated with the latest market developments and adjust your analysis accordingly.

